
Canadian Manufacturing
Market Intelligence Report
Whitehorn Capital's Canadian Manufacturing Industry Report presents performance trends and transaction activity observed in this sector in Canada. All financial data has been sourced from LSEG Workspace.
Whitehorn's Canadian Manufacturing Industry Report consists of Canadian companies active in Rubber & Plastics, Fabricated Metals, Milling & Building Products, Industrial & Commercial Machinery, Transportation Equipment, and Miscellaneous Manufacturing.
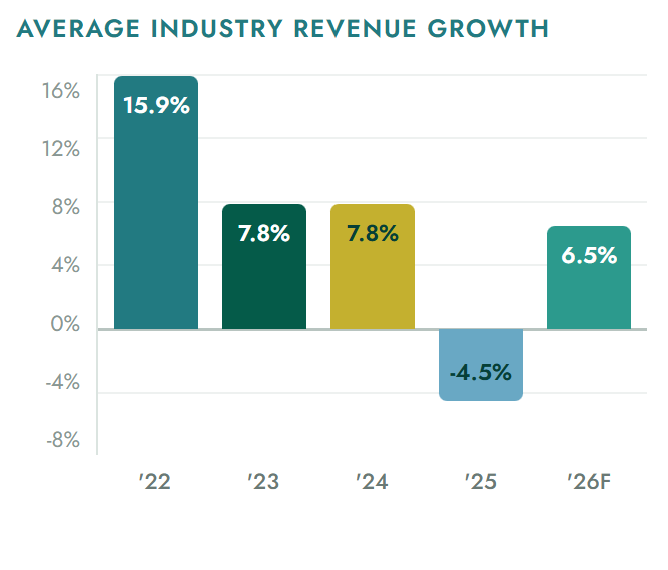
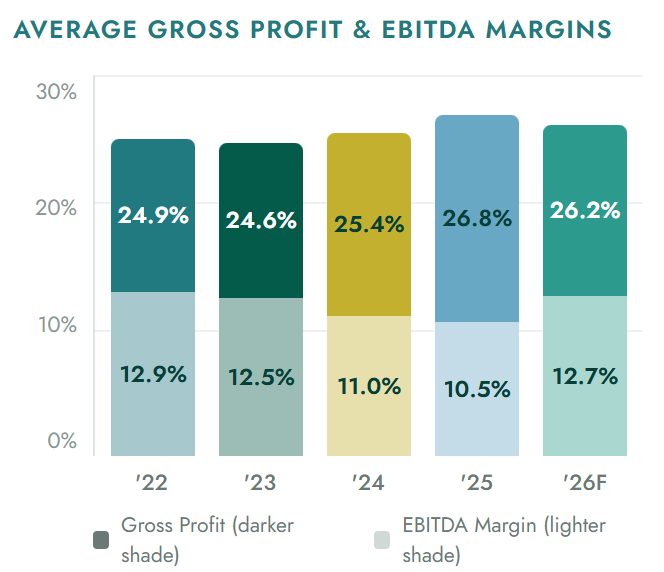
Market Dashboard
How Canada Lost its Manufacturing Backbone & Optimism for Rebound
Canadian manufacturing seems to have stalled. The sector's share relative to total GDP output has shrunk from 29% in the post WWII era to 8.5% today. Manufacturing activities also fell in the 21st century, predominantly driven by globalization and the increase in offshore manufacturing. However, we are seeing some optimistic signs of a rebound in the sector more recently, which we dive into further below.
Manufacturing was once the engine of the Canadian economy. Throughout the 20th century, manufacturing outputs were strong nationwide. However, since the turn of the century, other sectors such as oil & gas, homebuilding and financial services grew faster and outpaced manufacturing growth. Real manufacturing output diverged sharply from the rest of the economy since the 2000s, as seen in the chart below.
Source: Statistics Canada – GDP by industry; Statistics Canada – Manufacturing Labour 2025.

Source: Statistics Canada, CANSIM tables 383-0021 and 379-0031, and authors' calculations.
From 1961 to 2000, Canadian manufacturing grew at essentially the same rate as the overall business sector. After 2000, that changed — real manufacturing output stalled while the broader economy kept expanding. By 2016, the business sector was 35% above its 2000 level. Manufacturing was just 11% above it — and still below its pre-recession peak in several industries.
B. Manufacturing GDP: The Current Picture
In nominal dollar terms, Canadian manufacturing has grown significantly driven by inflation, population growth, and expanded trade. However, the nominal growth does mask a harsh reality: the structural pace of growth slowed sharply in the 2000s and the sector has been relatively flat in real terms for the last two decades.
| Era | Character of growth | Description |
|---|---|---|
| 1960s–1970s | Strong real growth | Manufacturing and business sector grow in lockstep. Trade liberalization and strong US demand drive output gains. |
| 1980s–1990s | Inflation + real expansion | Nominal numbers surge on inflation. Real output also grows, aided by the free trade agreement (1989) and a weaker Canadian dollar through the 1990s. |
| 2000–2007 | Real growth stalls | Nominal values breach $200B CAD on strong automotive and resource prices. But real manufacturing output grows just 0.7%/yr — a fraction of the US rate (3.1%/yr). Tech bubble burst, rising dollar, and global competition bite hard. |
| 2008–2010 | Sharp contraction | The 2008–09 recession hits manufacturing 5x harder than the broader business sector (-9.6% vs. -2% annual avg.). Transportation equipment collapses -32%. Recovery takes 6 years — the slowest since tracking began. |
| 2010–present | Structural friction | Nominal output fluctuates between $170B and $210B CAD depending on global commodity prices, currency strength, and trade conditions. Real output remains essentially flat. In 2025, manufacturing contracted 2.6% — its 3rd consecutive annual decline. |
Sources: Statistics Canada — Real Growth of Canadian Manufacturing Since 2000 (Cat. 11-626-X, 2017); Trading Economics Canada Manufacturing GDP Portal; Statistics Canada Table 36-10-4340-6; Statistics Canada GDP by Industry (2025-26 releases).

Source: Statistics Canada - GDP by industry.
In real terms, the Canadian manufacturing sector has been essentially flat for over two decades. Manufacturing's share of Canadian GDP has been relatively declining, driven primarily by global trade shifts.
C. Root Causes
We now investigate the two key factors behind the drastic decline: failure in trade policy and underinvestment.

It seems like forever ago where policy, capital and geopolitics were aligned in favour of Canadian manufacturing. After decades of neglect, federal policy seems to be pivoting towards a robust domestic industrial strategy, which we cover a few below:
The window of opportunity exists for Canadian manufacturers today. Here is what private manufacturers can do today:
Select Merger & Acquisition Transactions
Notable Canadian manufacturing transactions this past quarter.
| Date | Acquirer | Acquirer HQ | Target | Target HQ |
|---|---|---|---|---|
| Apr. 2026 | Metrie | Vancouver, BC | Certain assets of Northstar/TruBilt Doors | St. Thomas, ON |
| Acquisition of door fabrication, hanging and finishing assets in Eastern Canada from division of Cornerstone Building Brands to expand door manufacturing and service capabilities. | ||||
| Apr. 2026 | PFM Capital and BDC Growth Equity Partners | Canada | West Coast Machinery | Langley, BC |
| Acquisition of manufacturer and distributor of custom service truck bodies and hydraulic excavator attachments via Work Truck West and ShearForce Equipment. | ||||
| May 2026 | Maverick Aviation Group | Sherwood Park, AB | Genaire | Niagara, ON |
| Acquisition of aerospace engineering and manufacturing company specializing in aircraft fuel systems, ground support equipment and OEM to expand national footprint and technical capabilities. | ||||
| June 2026 | Decisive Dividend (TSXV:DE) | Kelowna, BC | Be Fire | Belgium |
| $19.9MM acquisition of specialty hearth manufacturer of wood-burning stoves, fireplaces, and fireplace inserts as add-on to its hearth vertical. | ||||
| June 2026 | Canfor (TSX:CFP) | Vancouver, BC | CanPinkwood's I-joist business | Calgary, AB |
| $8MM acquisition of engineered wood joists manufacturer for residential, multi-family, and commercial construction. | ||||
| June 2026 | Buhler Versatile | Winnipeg, MB | ATLAS Group | Germany |
| Acquisition of German construction machinery manufacturer to strengthen European market position. | ||||
| June 2026 | TerraVest Industries (TSX:TVK) | Toronto, ON | Jet Peinture Plus | Quebec City, QC |
| Acquisition of company specializing in propane tank refurbishment and tank recertification. | ||||
| June 2026 | Ballard Power Systems (TSX:BLDP) | Vancouver, BC | GeoPura | United Kingdom |
| £301MM acquisition of zero-emission hydrogen-based power solutions provider to increase end-to-end capabilities. | ||||
Check out more transactions on our website.
| Subsector | Q2 2026 | Q1 2026 |
|---|---|---|
| Rubber & Plastics | 6 | 3 |
| Fabricated Metals, Milling & Building Products | 6 | 10 |
| Industrial & Commercial Machinery | 11 | 9 |
| Transportation Equipment | 16 | 9 |
| Miscellaneous Manufacturing | 28 | 21 |
| Total | 67 | 52 |
Let's talk about your next move.
Whitehorn Capital provides sale of business, financing, and merger & acquisition services to Western Canadian private manufacturing companies. To discuss this quarter's findings, reach our team below.
All financial data has been sourced from LSEG Workspace. This report is prepared by Whitehorn Capital Inc. for informational purposes only and does not constitute investment, legal, or tax advice. Figures may include forecasts and are subject to change without notice.